


Ethereum (ETH) Price Predictions / Ethereum (ETH) Forecast
| After | Price | Change |
|---|---|---|
| 1 day | $87.4138 | 0.00% |
| 1 week | $88.6525 | 1.42% |
| 1 month | $94.3227 | 7.91% |
| 6 months | $166.4256 | 90.40% |
| 1 year | $380.4321 | 335.23% |
| 5 years | $1,464.7979 | 1,575.78% |
The Stochastic Oscillator is a range bound momentum oscillator. Stochastic oscillator is showing Neutral signal, with value at 20.78.
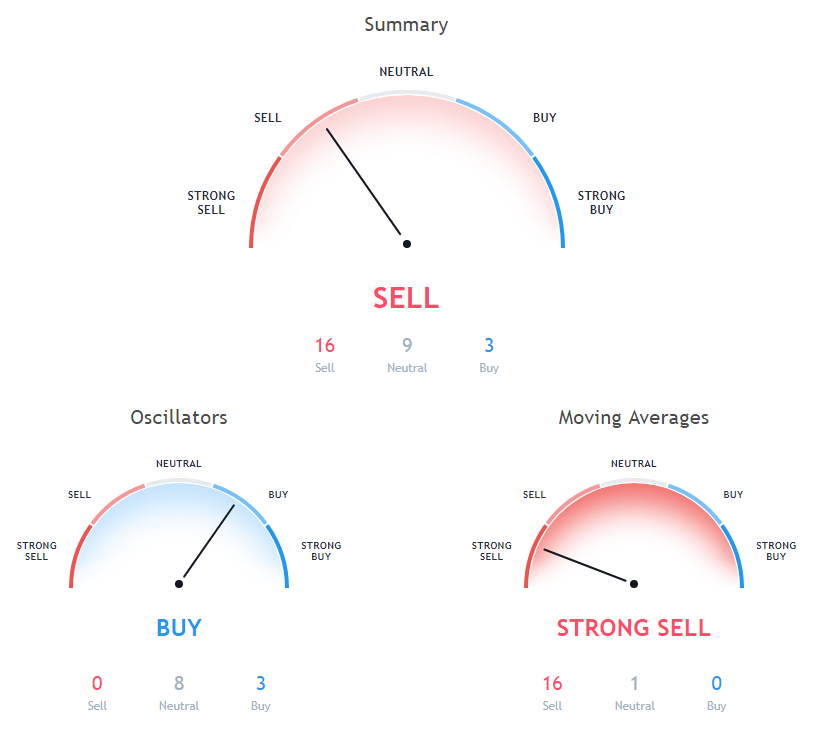
The Commodity Channel Index (CCI) is a momentum oscillator used in technical analysis to measure an instrument's deviation from its statistical average. Commodity Channel Index is indicating Neutral action, with value at -130.39.
The Relative Strength Index (RSI) is an important indicator for measuring the speed and variation of price movements. Its value ranges from zero and 100. The value around 30 and below is considered an oversold region and over 70 as oversold regions. Relative Strength Index is at 25.29, indicating Buy action.
Moving Average (MA) in simple term is just average of any subset of numbers. For example, 50 Days simple moving average is calculated at any point in chart by summing past 50 days of price and then dividing it by 50.
5 days Simple Moving Average is indicating Sell since Ethereum is trading at $87.41, below MAs value of 92.95. 100 days Exponential Moving Average is indicating Sell action with value at 202.02, Ethereum is trading below it at $87.41. 20 days Volume Weighted Moving Average is indicating Sell action with value at 109.18, Ethereum is trading below it at $87.41.
5 days Exponential Moving Average is at 93.41, showing Sell signal, Ethereum is trading below it at $87.41. 200 days Exponential Moving Average is indicating Sell action with value at 293.35, Ethereum is trading below it at $87.41. 50 days Simple Moving Average is at 161.31, showing Sell signal, Ethereum is trading below it at $87.41.
9 days Hull Moving Average is indicating Sell since Ethereum is trading at $87.41, below MAs value of 89.68. 9 days Ichimoku Cloud Base Line is indicating Neutral since Ethereum is trading at $87.41, below MAs value of 134.09. 30 days Simple Moving Average is indicating Sell since Ethereum is trading at $87.41, below MAs value of 130.95.
50 days Exponential Moving Average is at 150.36, showing Sell signal, Ethereum is trading below it at $87.41. 10 days Exponential Moving Average is indicating Sell since Ethereum is trading at $87.41, below MAs value of 99.42. 30 days Exponential Moving Average is indicating Sell action with value at 127.6, Ethereum is trading below it at $87.41.
20 days Simple Moving Average is indicating Sell action with value at 109, Ethereum is trading below it at $87.41. 200 days Simple Moving Average is indicating Sell since Ethereum is trading at $87.41, below MAs value of 314. 20 days Exponential Moving Average is at 113.78, showing Sell signal, Ethereum is trading below it at $87.41.
Also Read: Ledger Nano S vs Trezor: Review
100 days Simple Moving Average is at 190.1, showing Sell signal, Ethereum is trading below it at $87.41. 10 days Simple Moving Average is at 99.65, showing Sell signal, Ethereum is trading below it at $87.41.
Other Technical Price Analysis for today:
Bitcoin (BTC) Price Struggles To Climb Above $3,500 - Bitcoin Price Analysis - 11 Dec 2018
Monero (XMR) Price Faces Pressure Below $50 - Monero Price Analysis - 11 Dec 2018

